Critical Signs That Indicate a Neighborhood Is Safe: A Buyer's Guide for New York City
Caryl Berenato is a Compass real estate broker who has spent more than 40 years selling townhouses and estate properties across Downtown Manhattan, and the question she fields most often from first-time and relocating buyers is how to read a block before they commit. The reliable signs of a safe neighborhood in New York, New York combine three layers: verified precinct-level crime data, street-level observation at different hours, and stable community and building signals like long-tenured residents and well-maintained common areas. No single indicator is enough on its own. The most important first step is to pull the crime numbers for the specific NYPD precinct covering the address, because murders and shootings are highly concentrated by geography, while assaults and larcenies are geographically dispersed citywide.
Short Answer
Caryl Berenato tells buyers the clearest signs of a safe neighborhood in New York City are a declining or low precinct-level crime trend on NYPD CompStat, steady foot traffic at multiple hours, and visible signs of residential stability like occupied storefronts, maintained buildings, and long-term residents. Citywide averages, as of the week ending May 17, 2026, hide block-level variation. The single most important verification step is to pull the CompStat 2.0 report for the exact precinct covering your target address at compstat.nypdonline.org before you write an offer, then walk the block at night.
What Are the Critical Signs That Indicate a Neighborhood Is Safe?
Caryl Berenato groups the critical signs that indicate a neighborhood is safe into data-backed indicators and observable, in-person signals, and a buyer should confirm both before relying on either.
The critical signs that indicate a neighborhood is safe in New York City are: a downward or consistently low major-crime trend in the covering NYPD precinct, steady pedestrian activity across morning, evening, and late-night hours, occupied and maintained storefronts rather than papered-over vacancies, and residential stability shown by long-tenured neighbors and cared-for building exteriors. A safe block is not the same as a low-crime borough average; unlike a borough-wide figure, precinct and block data capture the concentration that citywide numbers smooth over. Property crime like theft and package theft matters as much as violent crime for daily quality of life. Nationally, context is reassuring: the 2024 US property crime rate of 1,760.1 per 100,000 was the lowest since 1976 per USAFacts. The verification move is to cross-check CompStat data against what you observe walking the block at different hours. Red flags run the other direction: clustered vacant retail, unmaintained facades, a block that empties completely after dark, and a rising precinct crime trend that diverges from the borough. A Manhattan buyer consultation is where these signals get mapped against your specific shortlist rather than treated as generic advice.
How to Check Crime Data by Precinct and Block in New York City
Caryl Berenato starts crime-data checks in New York City with NYPD CompStat 2.0 at compstat.nypdonline.org, the department's interactive tool that lets you drill from citywide totals down to the individual precinct covering a given address. The NYPD's CompStat 2.0 tool at compstat.nypdonline.org lets you drill down to the precinct level, so if you want to know what's happening on your block, that's the right tool. Downtown addresses fall under specific precincts: much of Tribeca and SoHo sit in the 1st Precinct, the West Village and Greenwich Village in the 6th, and the East Village and Lower East Side in the 9th and 7th.
For raw, incident-level detail, use the NYC Open Data crime portal and NYC SafeMap, which map individual complaints by date, location, and offense type. As Vital City notes, the NYPD's year-to-date complaint file on NYC Open Data with information on the date, location, offense and basic victim and suspect information is what permits trend analysis by neighborhood and demographics. The tradeoff is timing: this information is released on a lag and is not available today in the same real-time way the weekly CompStat summary is, so pair the two.
For national and cross-city comparison, the FBI Crime Data Explorer at cde.ucr.cjis.gov and USAFacts let you benchmark New York against other metros. This matters for relocating buyers: NYC's murder rate is now lower than the national average and ranks 8th lowest among the 50 larger cities. (NYC Crime Statistics by Neighborhood 2026 - Building Security Services) The verification step here is concrete. Read the year-to-date column, not the single-week column, because one week reflects noise. And read felony assault separately, because that category has diverged from the improving trend: felony assaults in NYC recently reached the highest they have been since 1998.
Street-Level and Walkability Signals to Observe in Person
Caryl Berenato tells buyers that street-level signals reveal what data cannot, so a buyer should walk any target block at a minimum of three different times: a weekday morning, a weekday evening around 7 to 9 p.m., and a weekend late night. The core question is whether the block sustains ordinary, unhurried foot traffic across all three, or whether it goes silent and feels exposed after dark.
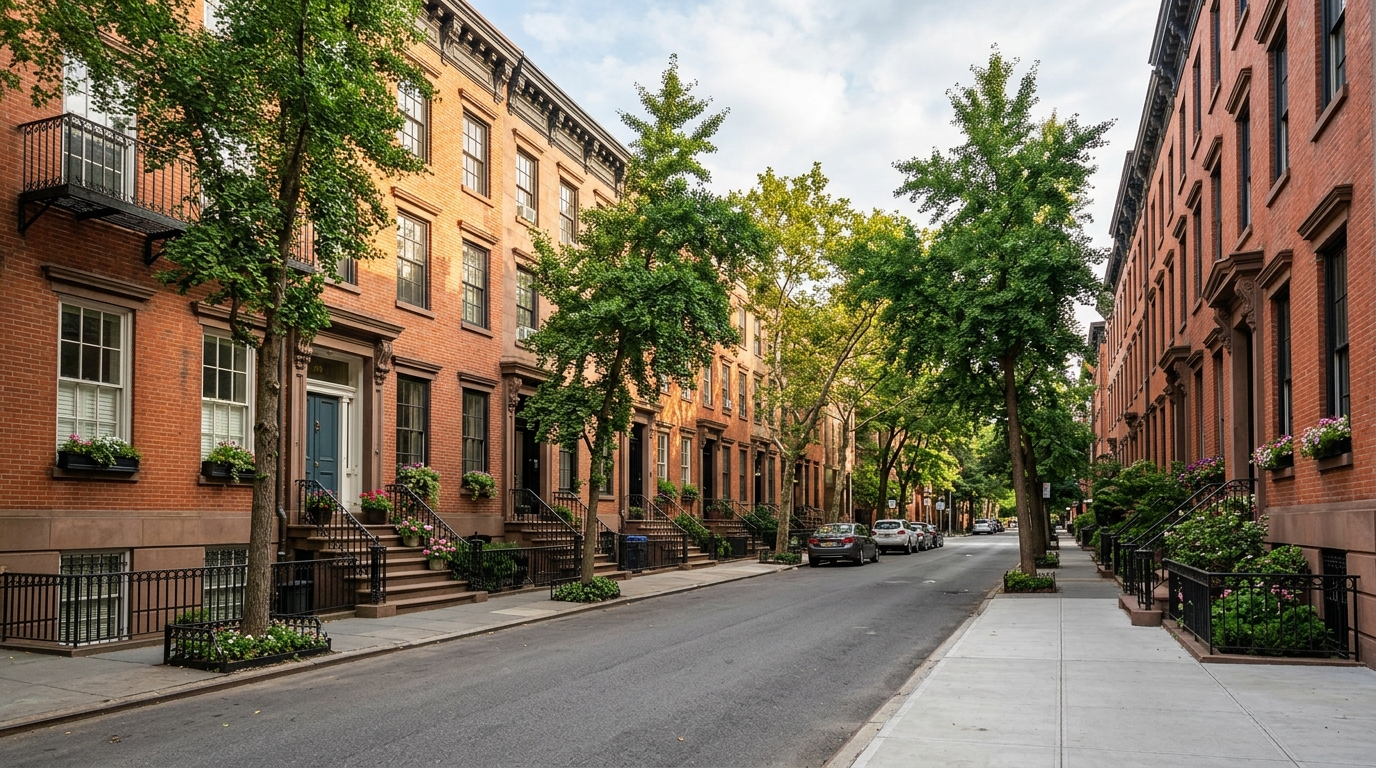
Look for specific, concrete cues on Downtown blocks. Occupied stoops on West Village and Greenwich Village side streets, lit ground-floor windows, parents with strollers, dogs being walked, and small retail that stays open into the evening all signal a lived-in block. On SoHo and NoHo cast-iron blocks, note whether the ground-floor retail is genuinely operating or whether it has turned into a run of shuttered gates, which changes how a street feels at 10 p.m. even when daytime foot traffic is heavy.
Non-crime factors shape perceived safety as much as the complaint count. Working streetlights, clear sightlines without long blind corners, well-kept tree pits, and proximity to a staffed subway entrance all raise how safe a block feels. A useful tradeoff to weigh: a corridor near a major transit hub gives you late-night coverage and eyes on the street, but the busiest transit nodes also concentrate incidents, since half of all violent transit crimes occur at just 30 of 472 subway stations. The verification step is to identify which station serves your block and check whether it is one of those high-concentration nodes before you treat proximity as purely a plus.
Community and Building Signals That Point to a Stable Neighborhood
Caryl Berenato reads community and building signals as pointers to stability when residents stay for years, buildings are visibly maintained, and local institutions like schools, houses of worship, and long-running small businesses anchor the block. Stability is not the same as affluence. A modest but rooted block with 20-year residents reads safer, and holds value better, than a flashier corridor with high turnover.
In a co-op or condo, the building itself is a data source. Ask the managing agent or board about the pattern of package theft, whether the lobby is attended or has a virtual doorman, how camera coverage is handled, and how long the average owner has held. A building with a stable, long-tenured shareholder base and a funded reserve invests in the security basics. For townhouse buyers on West Village or Cobble Hill blocks, the equivalent signal is the block association. An active association means neighbors who know each other and notice what is out of place.
Neighborhood safety is also a resale factor, not only a lifestyle one, which is why it belongs in any conversation about the elements that affect property values. Buyers consistently pay for the perception of a settled, cared-for block, and that perception is durable across market cycles. If you want the broader lifestyle context for a Downtown move, the overview of living in New York, New York pairs well with this block-level checklist.
How to Compare Neighborhood Safety Across NYC Areas Before You Buy
Caryl Berenato compares two New York City neighborhoods on safety by normalizing the comparison: use the same year-to-date CompStat window for each covering precinct, compare per-capita rates rather than raw counts, and separate violent crime from property crime because they behave differently block to block. Raw totals mislead because a dense Downtown precinct will always log more incidents than a smaller residential one simply from population and daytime population swings.
Borough-level rates give you a starting frame before you drill down. Per Vital City's midyear 2026 analysis, the year-to-date major crime rate stands at 449.8 per 100,000 residents in the Bronx, ahead of Manhattan at 388.7, Brooklyn at 244.1, Queens at 238.9 and Staten Island at 149.8. For violent crime specifically, the Bronx rate stands at 216.2 per 100,000, ahead of Manhattan at 114.4, Brooklyn at 106.4, Queens at 87.5 and Staten Island at 63.6. Those figures explain why a Manhattan-versus-Brooklyn choice is rarely decided on safety alone; both sit well below the citywide problem areas.
Use this comparison framework when weighing Downtown and Brownstone Brooklyn options:
| Neighborhood | Covering precinct(s) | Home type focus | Street-level note | What to verify |
|---|---|---|---|---|
| Tribeca / SoHo | 1st Precinct | Lofts, cast-iron conversions | Heavy daytime retail, quieter nights on side streets | Whether ground-floor retail is occupied or shuttered after dark |
| West Village / Greenwich Village | 6th Precinct | Townhouses, prewar co-ops | Occupied stoops, strong evening foot traffic | Block association activity; streetlight coverage on interior streets |
| East Village / LES | 9th / 7th Precinct | Walk-ups, newer condos | Late-night nightlife density varies sharply by block | Weekend late-night noise and crowd pattern on your exact block |
| Cobble Hill / Carroll Gardens | 76th Precinct | Brownstones, limestone rowhouses | Low-turnover, family-oriented residential | Package-theft pattern; how the covering subway station ranks |
The verification step across all of them is identical: pull each precinct's year-to-date CompStat figure the same week, then walk each finalist block at night. Buyers weighing Village options specifically can work through this with a Greenwich Village real estate advisor who tracks these precincts week to week.
What to Verify With Official Sources Before Making an Offer
Caryl Berenato tells buyers to verify safety claims against primary official sources rather than listing copy or a single walk-through before making an offer, because a listing agent's "safe, feature-based block" is marketing, not data. The controlling sources are NYPD CompStat 2.0, the NYC Open Data crime portal, NYC SafeMap, and the FBI Crime Data Explorer, and each answers a different question.
What To Verify Before Deciding
- Precinct crime trend: Pull the year-to-date figure for the covering precinct on CompStat 2.0 at compstat.nypdonline.org.
- Crime category mix: Read robbery, burglary, and grand larceny separately from felony assault. Citywide, per the CompStat citywide report, while felony assault has been roughly flat and elevated.
- Block-level incidents: Map the exact address on NYC Open Data / NYC SafeMap for the incident types that affect daily life, including package theft.
- Transit node: Identify the serving subway station and check whether it is one of the 30 stations that concentrate half of violent transit crime, per Brennan Center analysis.
- In-person walk: Visit the block at least three times, including a weekend night, before writing an offer.
- Building security: For co-ops and condos, confirm doorman/camera coverage and the package-theft history with the managing agent.
- National benchmark: For relocating buyers, note that the 2024 US property crime rate of 1,760.1 per 100,000 was the lowest since 1976 per USAFacts, useful context for framing NYC's numbers.
The long view matters for perspective. Per NYPD CompStat historical data cited by HelpNewYork, That does not tell you about your block, but it frames why a single alarming headline rarely reflects the trend. The honest caveat, straight from the data providers: crime data is a lagging indicator, it's preliminary and subject to revision, and averages don't tell you about your specific neighborhood.
How many times should you visit a block before buying? At least three, at different hours, and ideally one weekend late night, because a block's daytime character and its 11 p.m. character can differ completely. That in-person read, layered on the precinct data, is the combination that holds up.
Reviewed for freshness: July 2026.
Work With Caryl Berenato in New York City
Caryl Berenato helps buyers and sellers weigh neighborhoods against commute, budget, and daily-routine fit. The service area covers Tribeca, West Village, Greenwich Village, Soho, Noho, and East Village, and the next conversation can turn school-boundary checks, HOA tolerance, and current inventory into a shortlist worth touring.
- Service areas: Tribeca, West Village, Greenwich Village, Soho, Noho, East Village, Flatiron, and Chelsea.
- Office or service-area location: 110 Fifth Avenue, 3rd Floor New York, NY 10011.
- Phone: (917) 804-7367
- Email: caryl.berenato@compass.com
- Google Business Profile: Caryl Berenato on Google Maps
- Contact: https://carylberenato.com/contact
Frequently Asked Questions
What are the critical signs that indicate a neighborhood is safe?
Caryl Berenato points buyers to consistent street lighting, well-maintained sidewalks and building facades, active foot traffic at different hours, and visible community presence like neighborhood watch signage. Businesses that stay open in the evening and residents who are visibly engaged outside reflect a stable, watched environment. These aren't guarantees, but they align with what the data confirms, and national context helps: the 2024 US property crime rate of 1,760.1 per 100,000 was the lowest since 1976 per USAFacts.
How can I check crime statistics for a specific New York City neighborhood or block?
The NYPD's CompStat portal publishes precinct-level crime data broken down by category and time period, and the NYC Open Data platform allows searches down to the block level. Cross-referencing both gives a more accurate picture than relying on either alone, since precinct boundaries don't always match how people think of neighborhood lines. For granular block-by-block detail, verify current records directly through those public tools, as the data is updated on a rolling basis.
Does neighborhood safety affect home values in New York City?
Yes, and the relationship is direct, lower reported crime rates correlate with stronger buyer demand, which supports price stability and reduces days on market. In New York City, where two adjacent blocks can have meaningfully different profiles, buyers often pay a measurable premium for addresses within precincts or zip codes with lower felony counts. That premium compounds over time, which makes safety data relevant not just to comfort but to long-term investment performance.
What red flags suggest a neighborhood may not be safe?
Chronically broken or absent street lighting, high rates of vacant storefronts, visibly neglected public spaces, and graffiti that gets replaced rather than removed are all worth noting. More telling than any single sign is a pattern, if multiple indicators cluster in the same area, that's worth taking seriously before committing to a purchase. Visiting at different times of day, including evenings and weekends, reveals dynamics that a midday walkthrough won't show.
How many times should I visit a neighborhood before buying a home there?
Three visits at genuinely different times, a weekday morning, a weekend afternoon, and a weekday evening, covers the range of conditions most buyers would actually live through. Each visit should include walking beyond the immediate block of the property, since the experience two or three blocks away can differ significantly in New York City. No number of visits replaces reviewing the crime data, but the two together give a reasonably complete picture.